
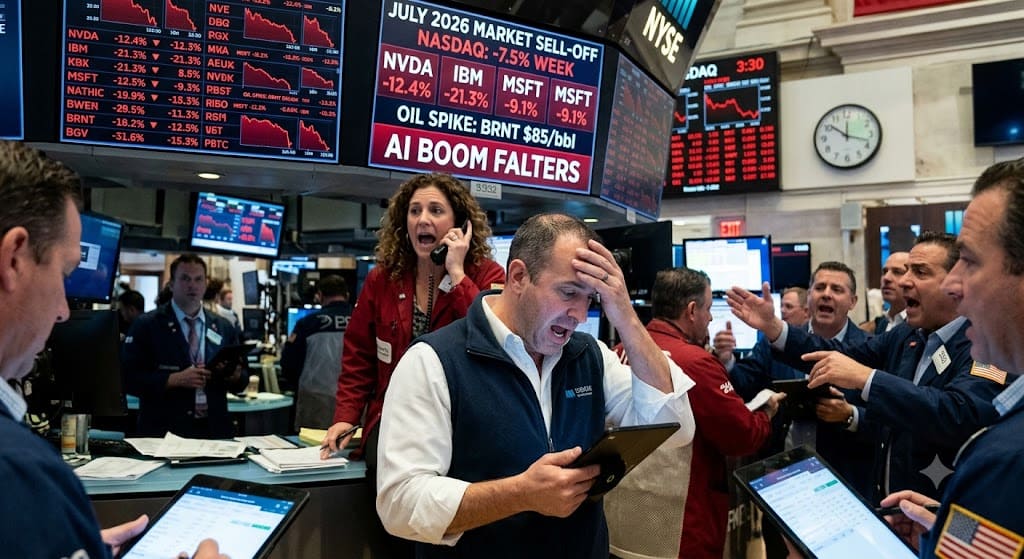
The short version: chip and AI stocks just had their worst week in more than a year, and it’s dragging the rest of the market down with it. The Philadelphia Semiconductor Index fell 11% for the week, its steepest weekly drop since early 2025, and is down almost 24% from its late-June record. The S&P 500 lost 1.6% on the week, the Nasdaq Composite dropped 2.9%, and the Dow shed 0.9%. The trigger was a new AI model from Chinese startup Moonshot that investors read as a threat to the “spend billions on chips first, ask questions later” thesis that’s been driving the market since 2023.
If you’ve been watching your 401(k) or brokerage app with a knot in your stomach this week, you’re not imagining it. This was a real rotation, not just noise.
What actually happened this week
Friday, July 17, closed with the S&P 500 down 1.01% to 7,457.69, the Nasdaq Composite off 1.4% to 25,520.24, and the Dow Jones Industrial Average down 406.55 points, or 0.77%, to 52,146.42. None of those single-day moves looks dramatic on its own. What made the week ugly was that it was the fourth session in a row where the same group of stocks kept dropping.
The VanEck Semiconductor ETF (SMH) fell more than 4% on Friday alone and has lost almost 9% over the week, its third weekly decline in four weeks. Chipmakers Applied Materials, Lam Research, Intel, KLA Corp, and Arm Holdings each fell roughly 4% on Friday, while Micron and Nvidia dropped more than 2%. Meta Platforms led the “Magnificent Seven” group lower, down about 3.5% on the day.
Here’s the part that actually explains the “former favorites” framing: this isn’t a broad market crash. Berkshire Hathaway, the definition of a boring, diversified value stock, climbed more than 1% on Friday as investors rotated into it, helped along by analyst estimates that Warren Buffett’s company bought back somewhere between $5 billion and $11 billion of its own stock last quarter. Apple, meanwhile, briefly overtook Nvidia as the world’s most valuable company, with a market cap near $4.9 trillion, as money moved out of the riskiest AI infrastructure names and into safer mega-caps.
So the stocks that got hit hardest weren’t the market as a whole. They were specifically the names that had carried the rally for the past two years: the chipmakers, the AI infrastructure plays, and the high-multiple software names that only make sense if the AI spending boom keeps accelerating forever.
Why chip and AI stocks specifically got crushed
A Chinese AI startup released a model that spooked the “US-only” AI trade, and a Netflix earnings miss added fuel to a market already nervous about stretched valuations. Moonshot, a Chinese AI company, debuted a model it says performs on par with the leading systems from OpenAI and Anthropic. For a market that has been paying nosebleed multiples for US chip and AI infrastructure stocks partly on the assumption that American companies have a durable lead, that’s an uncomfortable headline. Traders responded by selling first and asking questions later.
That news landed on top of a market that was already jumpy. Oil prices climbed roughly 2% to above $80 a barrel as the conflict between the US and Iran continued, and Netflix shares suffered double-digit losses after its latest earnings report disappointed investors. None of these are unrelated coincidences. They’re all reasons for a market that had priced AI-related names for perfection to start asking whether “near-perfect demand forever” is actually a safe bet.
I don’t think this is really about Moonshot’s model being better than anything from OpenAI or Anthropic. It’s about what happens to a trade that’s gotten crowded: once one crack shows up, everyone remembers how far these stocks have run and how little room for disappointment is priced in.
Semiconductor stocks vs. the broader market this week
| Metric | This week’s move | As of |
|---|---|---|
| S&P 500 | -1.6% for the week | July 17, 2026 |
| Nasdaq Composite | -2.9% for the week | July 17, 2026 |
| Dow Jones Industrial Average | -0.9% for the week | July 17, 2026 |
| PHLX Semiconductor Index (SOX) | -11% for the week; -24% from late-June record | July 17, 2026 |
| VanEck Semiconductor ETF (SMH) | -4%+ Friday; -9% for the week | July 17, 2026 |
| Nvidia (NVDA) | Down more than 2% Friday | July 17, 2026 |
| AMD | -4.9% | July 17, 2026 |
| Applied Materials (AMAT) | -6.5% for the week | July 17, 2026 |
| Meta Platforms (META) | -3.5% Friday | July 17, 2026 |
| Apple (AAPL) | Market cap ~$4.9 trillion, passed Nvidia as most valuable company | July 17, 2026 |
| Berkshire Hathaway (BRK.B/A) | +1%+ Friday | July 17, 2026 |
| WTI crude oil | Above $80/barrel | July 17, 2026 |
Figures compiled from CNBC, Bloomberg, Reuters, and Yahoo Finance market coverage of July 17, 2026 (see Sources below).
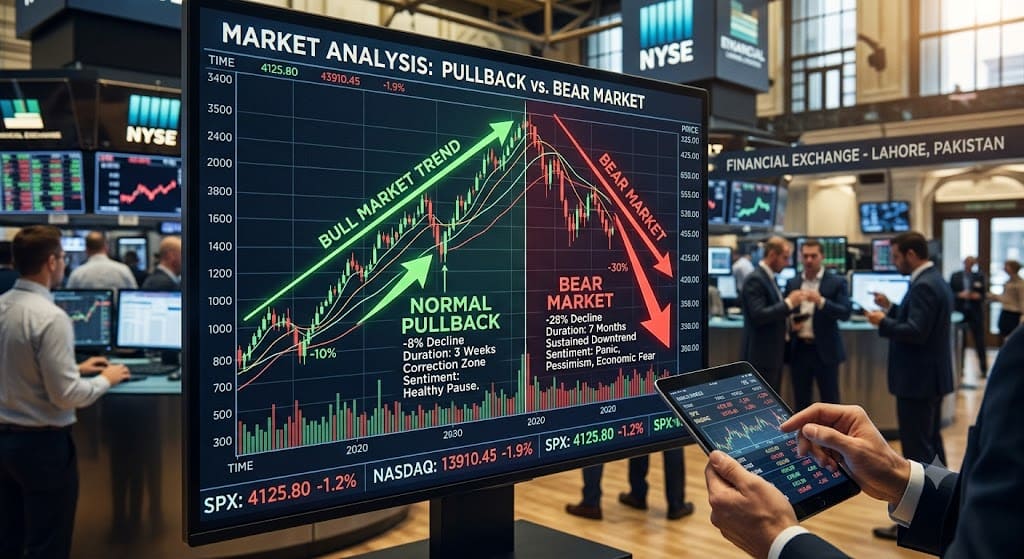
Is this a bear market or a normal pullback?
The semiconductor sector meets the technical definition of a bear market, which is typically a drop of 20% or more from a recent high, since the SOX index is down roughly 24% from its late-June peak. That’s a real, measurable decline, not just a bad headline day.
But “bear market in one sector” is different from “bear market in the whole economy.” The broader S&P 500 is still nowhere near a 20% drawdown, and this week’s move looks more like a valuation reset in a specific, very crowded trade than a signal that the economy itself is turning over. Fed Chair Kevin Warsh’s recent comments on how the central bank is thinking about inflation, and this week’s improving consumer sentiment data, don’t point toward a broader downturn story. This looks like money rotating out of one expensive corner of the market and into cheaper, steadier names, which is exactly what Berkshire’s gain and Apple’s rotation-driven rally on the same day suggest.
Warren Buffett recently described some of what’s going on in today’s market as “gambling,” which is a blunt way of making the same point: a lot of capital has been chasing a narrow set of stories, and narrow, crowded trades are the ones that unwind hardest when sentiment shifts even slightly.
What this actually means if you own these stocks
I’m not going to tell you to sell everything or that this is definitely the top, because nobody actually knows that in real time, including people paid a lot of money to guess. What I will say: if a single stock or sector has grown to be a much bigger slice of your portfolio than you originally intended, purely because it went up so much, this kind of week is a decent prompt to check your actual allocation rather than just your account balance.
The SEC’s own investor guidance makes a point worth repeating here: your best move during a volatile week is usually to stick with a plan you built during a calm one, not to make a new plan under stress. A diversified, risk-appropriate portfolio is designed to absorb exactly this kind of sector-specific shakeout without you needing to do anything dramatic.
If you’re not sure whether a market swing like this actually changes your monthly numbers, it’s worth running your budget through FinToku’s Budget Planner & 50/30/20 Calculator before you make any moves, so a portfolio dip doesn’t turn into a cash-flow problem too.
Key Takeaways
- Chip and AI stocks had their worst week in more than a year, with the PHLX Semiconductor Index down 11% for the week and about 24% below its late-June record.
- The broader market fell too, with the S&P 500 down 1.6% and the Nasdaq down 2.9% for the week, but far less severely than semiconductors.
- The trigger was a competitive AI model from Chinese startup Moonshot, combined with a disappointing Netflix earnings report and rising oil prices tied to the US-Iran conflict.
- Money rotated into defensive, diversified names like Berkshire Hathaway and into Apple, which briefly passed Nvidia as the world’s most valuable company.
- This looks like a valuation reset in a crowded AI trade, not confirmed evidence of a broader economic downturn.
Frequently Asked Questions
Why did the stock market sell off this week?
Chip and AI stocks led the decline after a new AI model from Chinese startup Moonshot raised doubts about the durability of the US AI spending boom, compounding pressure from a weak Netflix earnings report and rising oil prices tied to Middle East tensions.
Are semiconductor stocks officially in a bear market?
The PHLX Semiconductor Index is down roughly 24% from its late-June record, which meets the common definition of a bear market (a 20%+ drop from a recent high), even though the broader S&P 500 and Nasdaq are down far less.
Should I sell my tech or AI stocks right now?
This isn’t personalized advice, but a broad principle applies: selling in reaction to a single volatile week usually means locking in a loss based on short-term sentiment rather than your original investment plan. It’s worth reviewing whether any one stock or sector has grown into an outsized share of your portfolio, and rebalancing on that basis rather than on the headline of the week.
What’s the difference between this and a broader market crash?
A broader crash would mean most sectors falling together on fears about the whole economy. This week, money rotated out of expensive AI-linked names and into defensive, diversified stocks like Berkshire Hathaway, which actually rose. That pattern looks more like a sector-specific valuation correction than an economy-wide selloff.
What caused Netflix stock to drop this week?
Netflix shares fell by double digits after its latest quarterly earnings report came in below what investors were expecting, adding to the pressure on an already nervous market.
Whatever you decide to do with your own portfolio, it’s worth checking your numbers against a plan you set when markets were calm, not against this week’s headlines. If your allocation still matches your actual goals and timeline, a rough week for a handful of former favorites doesn’t have to change anything at all.
Disclaimer
This article is for general informational purposes only and shouldn’t be taken as financial, investment, or tax advice. The stock and index moves referenced here reflect market conditions as of July 17-18, 2026, and can change quickly. Before making any real investment decision, including rebalancing a portfolio in response to a volatile week like this one, it’s worth checking with a qualified financial advisor who can look at your specific situation. You can also read FinToku’s full Financial Disclaimer.
Published by Saad Faisal for FinToku (fintoku.com) · Published July 18, 2026 · Updated July 18, 2026 FinToku provides free finance tools and guides to help you make smarter money decisions.
Sources
- CNBC, “Stock market news for July 17, 2026”
- Bloomberg, “US Stock-Index Futures Slide as Jitters Grow on Chip Selloff”
- Bloomberg, “Stock Market Today: Dow, S&P Live Updates for July 17”
- Yahoo Finance / Reuters, “Chipmakers and other high-flying stocks slide as AI trade wobbles”
- Yahoo Finance, “Stock market today: Nasdaq leads Dow, S&P 500 lower as chip stocks bounce off lows”
- The Motley Fool, “Stock Market Midday, July 17: Netflix Plunges and Stocks Slide as Semiconductor Sell-Off Deepens”
- U.S. Securities and Exchange Commission, Investor.gov, “Don’t Panic, Plan It!”